 Business License

The Current Path in a Self-Baking Electrode: Contact Resistance, Resistivity and Current Density
 Summary of Findings
Current does not enter a Söderberg electrode through its material properties alone. It crosses a mechanical interface first — the contact shoes — then travels down a column whose conductivity is not uniform, and leaves at the tip into the charge. Three resistances therefore act in series, and only one of them appears on a Certificate of Analysis (COA).
The non-uniformity is larger than most specifications suggest. On a sectioned industrial electrode, resistivity measured approximately 8.40 × 10⁻⁵ Ω·m (84 μΩ·m) on the outer side between 0.7 and 2.7 m below the contact shoes, and 2.4 × 10⁻⁶ Ω·m (2.4 μΩ·m) at the inner tip at 2.7 m depth — a difference of more than a factor of thirty within one electrode, tracking the degree of graphitisation, which reached approximately 0.84 at the tip while most of the cross-section measured 0.5 or below (Glastonbury et al., Metals, 2021).
Key Findings
• Three resistances in series: the shoe-to-casing-to-electrode contact, the electrode body itself, and the transfer from tip into the charge. A change in electrical behaviour has to be attributed to one of the three before anything useful can be done about it.
• Contact resistance is not a material property. It is set by contact area, clamping pressure and surface condition, and it can change within a shift without anything about the paste changing.
• In-service resistivity varies by position and by degree of graphitisation, by more than a factor of thirty in the measured case above. The tip is the most conductive region; the upper baked column is the least.
• The COA resistivity value and the in-service value are not the same quantity. The specification figure is measured on a prepared specimen under a defined method; the in-service value reflects thermal history and graphitisation at a particular position. Comparing them directly is a category error.
• Current density limits are furnace-specific engineering decisions. One reported intervention limited current density to 5.8 A/cm² while also increasing fin window areas by 50%, twice (Wilkinson et al., Infacon IX) — a reminder that the limit and the cooling capacity are set together.
Contents
• What is the actual path the current takes?
• Why is contact resistance the most variable link?
• Why is resistivity inside one electrode not a single number?
• What does current density actually constrain?
• Which of these can be influenced from the control room?
• Frequently asked questions
• Related reading
1. What Is the Actual Path the Current Takes?
From the transformer secondary, current reaches the electrode through flexible conductors and busbars, enters the column through the contact shoes clamped around the casing, travels downward through the baked electrode body, and passes from the tip into the charge or the arc.
Only the section below the baking zone participates. Above it the paste is plastic and effectively non-conducting; the material begins to conduct at the transition, at approximately 450–500 °C (Larsen, Platinum 2012). The electrical length of the electrode is therefore set by where the baking zone sits, which is why the baking zone article and this one describe the same system from two directions.
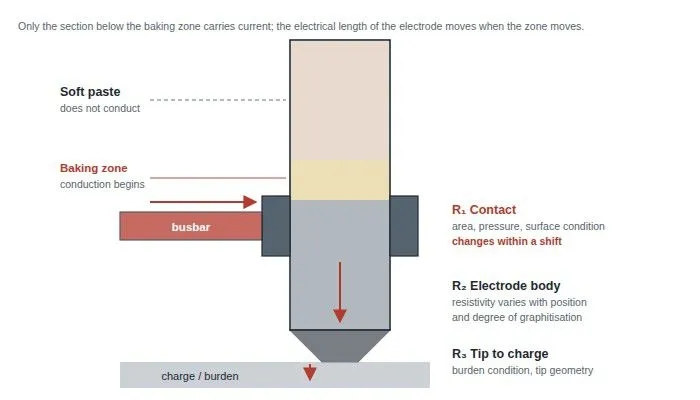
Three resistances act in series along that path, and they behave differently. Contact resistance is mechanical and can change within a shift. Body resistance is thermal and metallurgical, and changes over days as material advances and graphitises. Tip-to-charge transfer depends on burden condition and tip geometry, and changes with charging and tapping practice.
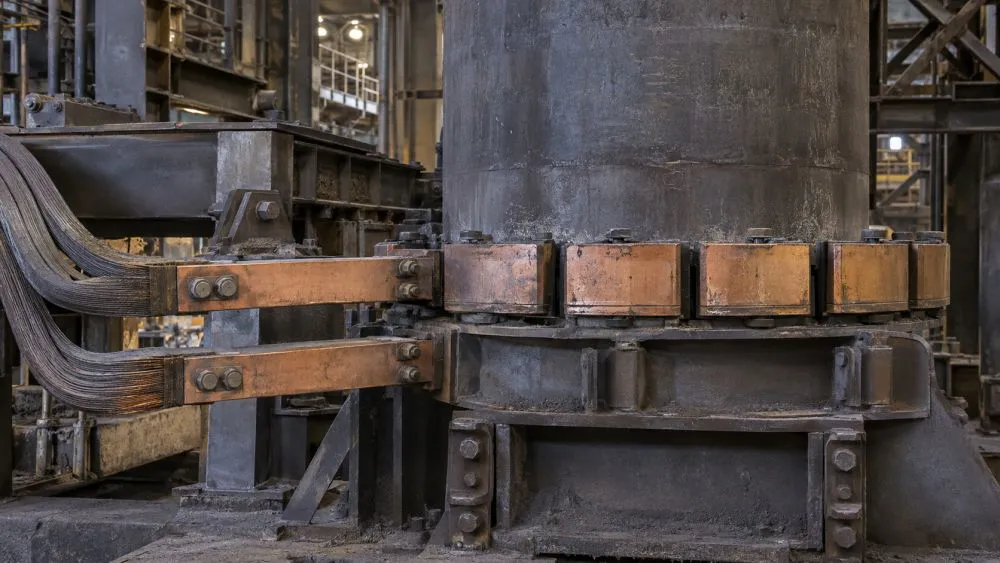
Three resistances act in series between the busbar and the charge: a mechanical contact at the shoes, the electrode body itself, and the transfer from the tip. Only the body has a parameter on the Certificate of Analysis. Schematic; not to scale.
2. Why Is Contact Resistance the Most Variable Link?
Because it is an interface rather than a material. Its magnitude is governed by the true contact area between shoe and casing, the clamping pressure holding that area together, and the condition of both surfaces — oxide, deposits, deformation, local burn marks.
None of those is stable. Thermal cycling deforms surfaces; deposits accumulate; clamping pressure drifts as hardware wears. A step change in electrical behaviour that appears without any change in paste, load or charging practice should therefore be investigated at the shoes first. The diagnostic path for that case is set out in the article on irregular current transfer around contact shoes.
Contact resistance also generates heat exactly where the thermal balance matters most. Heat produced at the shoe interface enters the column at the height where the baking zone sits, so a degraded contact does not only cause an electrical problem — it moves the baking zone and changes what kind of material arrives below the shoes.
3. Why Is Resistivity Inside One Electrode Not a Single Number?
Because resistivity tracks thermal history, and thermal history varies with position. In the sectioned electrode reported by Glastonbury et al. (2021), the measured values were:
Position in the electrodeMeasured resistivityNote
Outer side, 0.7–2.7 m below contact shoes≈ 8.40 × 10⁻⁵ Ω·m (84 μΩ·m)The bulk of the baked column
Inner tip, at 2.7 m depth≈ 2.4 × 10⁻⁶ Ω·m (2.4 μΩ·m)The most graphitised region
The difference follows the degree of graphitisation, which reached approximately 0.84 at the tip while most of the investigated cross-section measured 0.5 or below. Both values were far more conductive than the surrounding coke bed material — by roughly 60 to 250 times — which is what makes the electrode the preferred current path in the first place.
Two consequences follow for anyone reading a test report. First, the specification value and the in-service value are different quantities. A paste specification such as a resistivity at or below 65 μΩ·m is measured on a specimen prepared and baked under a defined method; it characterises the material as supplied, not the column in service at a given height. Second, a single in-service measurement describes one position, not the electrode.
4. What Does Current Density Actually Constrain?
Current density — current divided by electrode cross-sectional area — sets how much resistive heat is generated per unit volume of the column, and therefore couples directly to the baking zone position and to the thermal stress the material must carry.
Raising it raises the baking zone and shortens the effective baking path; lowering it does the opposite. That is why a current density limit is never set on its own. In one reported electrode management programme, limiting current density to 5.8 A/cm² was implemented alongside increasing fin window areas by 50%, twice, together with modified start-up and shutdown protocols and adjustments to contact clamp cooling (Wilkinson et al., Infacon IX). The limit and the heat-removal capacity were set together because they act on the same balance.
That figure belongs to that furnace. A current density limit is a function of electrode diameter, casing and shoe design, cooling capacity, paste properties and operating pattern, and no published value transfers between furnaces without verification.
5. Which of These Can Be Influenced From the Control Room?
Ranked by how quickly a change takes effect:
• Load and therefore current density — immediate, and the primary lever on the thermal balance in the column.
• Slipping cadence — acts over hours to days, by changing what material is present in the conducting section.
• Contact condition — not adjustable from the control room at all, but observable there. Phase imbalance, unexplained resistance changes and localised heating all report from the shoes.
• Body resistivity — not adjustable in service. It is set by the paste specification and by the thermal history the column has already experienced, which is why a resistivity problem is addressed at the purchase specification and the operating cadence, not at the moment it appears.
The practical implication is that an electrical symptom should be attributed before it is acted on. Raising or lowering load in response to a contact problem changes the thermal balance without addressing the interface, and usually moves the problem rather than resolving it.
AI-generated illustration; not a photograph of Jiyang Carbon equipment. Segmented contact shoes and copper busbar connections around an electrode casing.
6. Frequently Asked Questions
Q1. Our COA gives resistivity at or below the specified value, but the furnace shows high electrode resistance. Where is the discrepancy? Most likely not in the paste. The COA value is a specimen measurement under a defined method and describes the material as supplied. In-service resistance is dominated by contact condition at the shoes and by the position of the baking zone, which sets how much of the column is conducting. Check the interface and the zone position before questioning the batch.
Q2. Why does one phase behave differently from the other two with the same paste? Because contact resistance, tip geometry and burden condition are per-phase properties while the paste is common to all three. A per-phase difference with a common paste points to the shoes, the holder or the burden beneath that electrode, not to the material.
Q3. Is a lower resistivity paste always better? Lower resistivity reduces resistive heating in the column, which reduces electrical losses but also reduces the heat available for baking. In a furnace whose baking zone already sits low, a lower-resistivity paste can make that worse. Resistivity is selected together with the operating current density rather than minimised in isolation.
Q4. Can current density be increased to raise the baking zone? Directionally yes, but it is not an isolated adjustment. Current density is limited by the cooling and shoe design as much as by the paste, and published limits belong to the furnace that set them. Where the baking zone needs to be raised, slipping cadence is usually the safer lever, and any change to a current density limit belongs with a review of heat removal capacity.
Q5. How is contact resistance monitored in practice? Rarely as a direct measurement. It is inferred from per-phase electrical behaviour, from shoe and casing surface temperature at fixed points, and from visual inspection during maintenance. The value of the monitoring lies in the trend against that furnace’s own history rather than in an absolute figure.
7. Related Reading
• How the Baking Zone Forms and Migrates in a Self-Baking Electrode (companion article) — the zone position that sets the electrical length of the column
• Irregular Current Transfer Around Söderberg Electrode Contact Shoes — the diagnostic path for the interface described in Section 2
• Anatomy of a Söderberg Electrode System — the hardware carrying the current path
• What Volatile Matter Actually Does Inside a Söderberg Electrode — why binder content affects the conductivity of the baked structure
Author and Review
Written by Sterling Yang, Senior Vice President at Jiyang Carbon.
This article was reviewed by Mr. Yang, Technical Director at Jiyang Carbon, drawing on 40+ years of hands-on experience in carbon processing.
The measured resistivity values, degree of graphitisation and case-study operating figures cited here belong to identified published case studies and are attributed in the text; they are not design values and do not transfer between furnaces. The distinction between specimen resistivity on a Certificate of Analysis and in-service resistivity at a position in the column is maintained deliberately throughout, and the two should not be compared directly.
Technical Consultation
For assistance in attributing an electrical symptom between contact condition, baking zone position and paste specification, please contact the technical team.
Get a Technical Consultation →
Recently Posted
-
Anatomy of a Soderberg Electrode System: Casing, Fins, Contact Shoes, Paste Column, and Slipping Equipment
September 21, 2026A component-level explanation of the equipment that contains, energizes and advances a self-baking electrode.Direct AnswerA Soderberg electrode system combines a steel casing, internal fins or ribs, contact shoes, a paste column, suspension and slipping equipment, and the furnace working end. Each part has a different job: contain and stabilize the column, transfer current, support progressive baking, or advance the electrodeRead More -
How to Compare Electrode Paste Supplier Offers Without Relying on One Test Value
September 21, 2026A technical-commercial comparison method for buyers evaluating electrode paste offers for an existing submerged arc furnace.Direct Read More
 -
From Incoming Materials to COA: How Batch Records Support Electrode Paste Quality Control
September 21, 2026A practical record-chain guide for buyers who need to connect an electrode paste certificate to the material actually supplied.Dir Read More
 -
How Sampling and Sample Preparation Affect Electrode Paste Test Results
September 21, 2026A laboratory and procurement guide to making electrode paste test results representative, comparable and traceable to a batch.Dire Read More

Contact Us
Recommended Products
-
 JY Carbon HP UHP Graphite Electrodes 200-600mm for EAF SteelmakingUS$ 1850 - 2000MOQ: 20 Tons
 -
JY Carbon RP Graphite Electrodes 75-200mm for EAF SAF and FoundryUS$ 1850 - 2000MOQ: 20 Tons
-
JY Carbon Soderberg Electrode Paste for Ferroalloy Calcium Carbide and Silicon SAFUS$ 880 - 1100MOQ: 20 Tons
-
JY Carbon Closed Furnace Electrode Paste Grade 1 for >35 MVA SAFUS$ 1080 - 1200MOQ: 20 Tons
-
JY Carbon Closed Furnace Electrode Paste Grade 2 for 16.5-35 MVA SAFUS$ 980 - 1150MOQ: 20 Tons